


Equity & Belonging
Diversity report 2021
December 16, 2021
Amie Ninh


What does diversity look like for employees at Clever? This post is part of a series focused on inclusion and belonging.
For several years, we have publicly shared Clever’s demographic data. We believe that sharing this information, taking accountability for it, and creating clear action steps to increase diversity are critical to becoming the organization we ultimately aspire to be.
The data
This information was collected from an organization-wide survey administered in October 2021. For previous data, please see our 2020 Diversity Report. Please also see our notes on methodology at the bottom of this post.
What the data tells us
Race at Clever
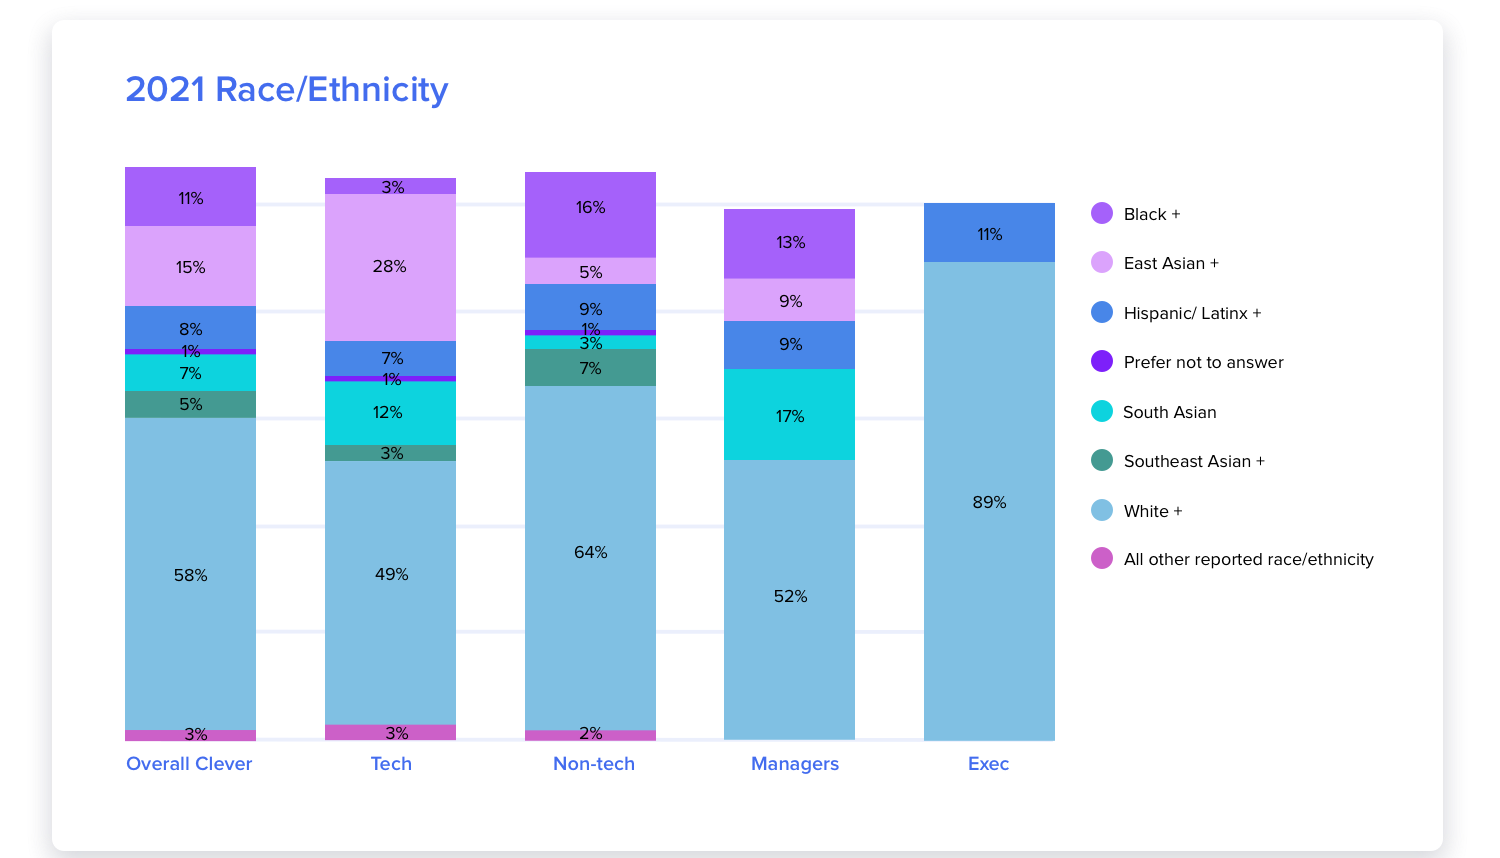
For Clever overall, we increased the representation of our Black employees from 8% in 2020 to 11% in 2021. Unfortunately, we were unable to increase the representation of Latinx employees this year, which remains at 8%, the same as 2020.
In our technical departments, engineering and product, there are some shifts in racial diversity compared to 2020. We saw an increase in the percentage of Latinx employees and East Asian employees and slight increases in the percentage of South Asian and white employees. That said, the percentage of Black employees remained the same as in 2020.
We see the increased number of Black employees primarily reflected in our non-technical departments. These departments also saw slight increases in the percentage of South Asian, Southeast Asian, and white employees, and slight declines in the representation of our East Asian and Latinx employees.
This year, we increased the overall number of managers at Clever. Unfortunately, there was a decline in the percentage of Latinx-identifying and East Asian managers. However, our group of Black-identifying managers increased, as well as our group of South Asian-identifying managers. Overall, there is a greater percentage of white managers in 2021 than in 2020.
Gender identity and expression at Clever
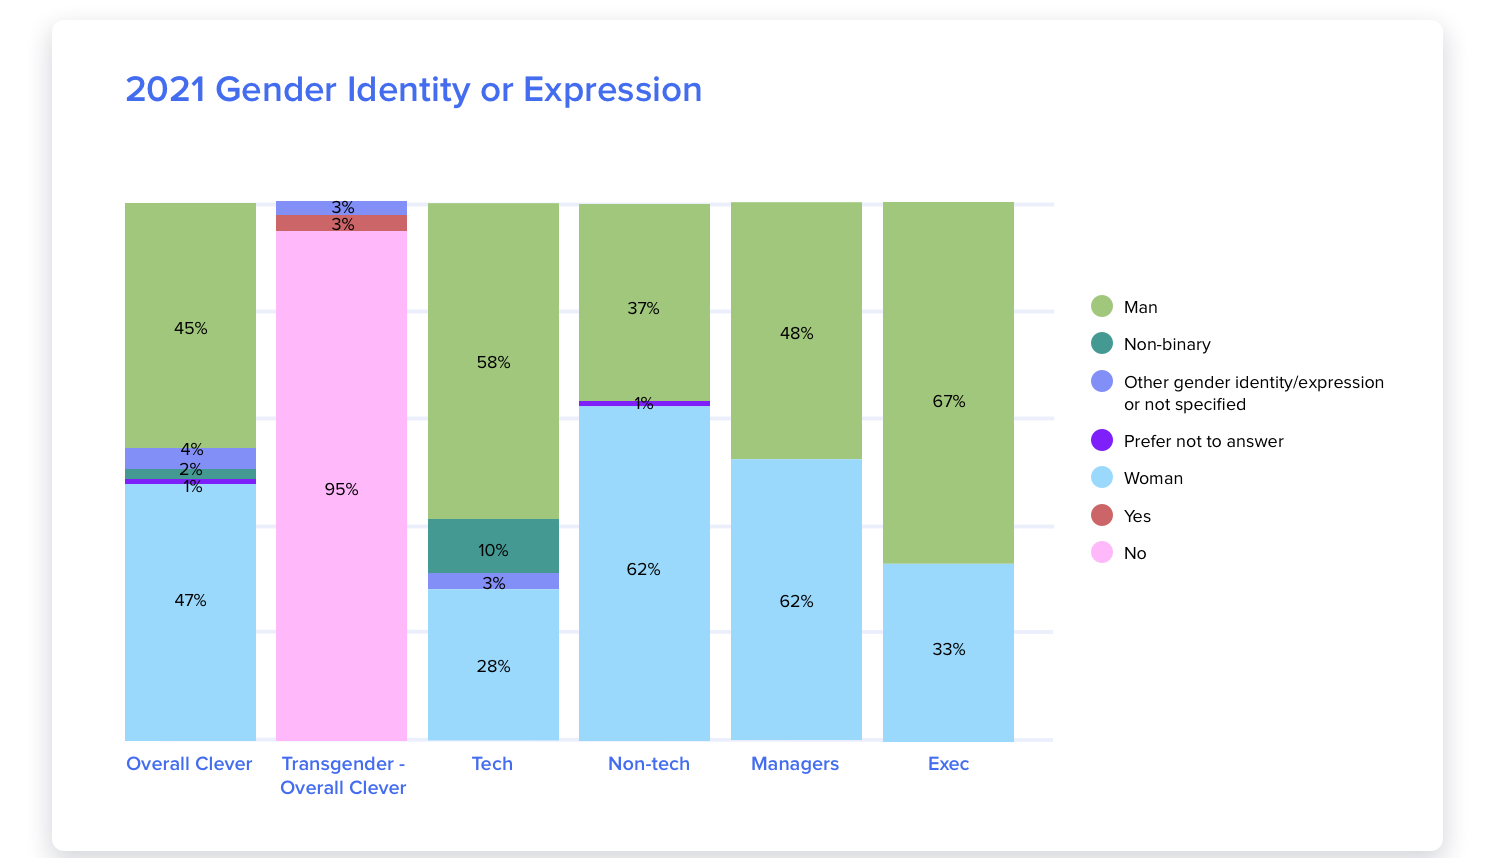
At Clever overall, we have a relatively balanced employee base in terms of gender on the binary (ex. men and women). That said, we know gender identity and expression are not on the binary and on a spectrum. Currently, 4% of our employees identify as gender non-binary, and we have to continually work to increase the representation of non-binary employees.
Our current data reveals that employees who identify as women or gender non-binary comprise 32% of our engineering org and 38% of our overall tech org (engineering + product).
Intersectional race and gender at Clever
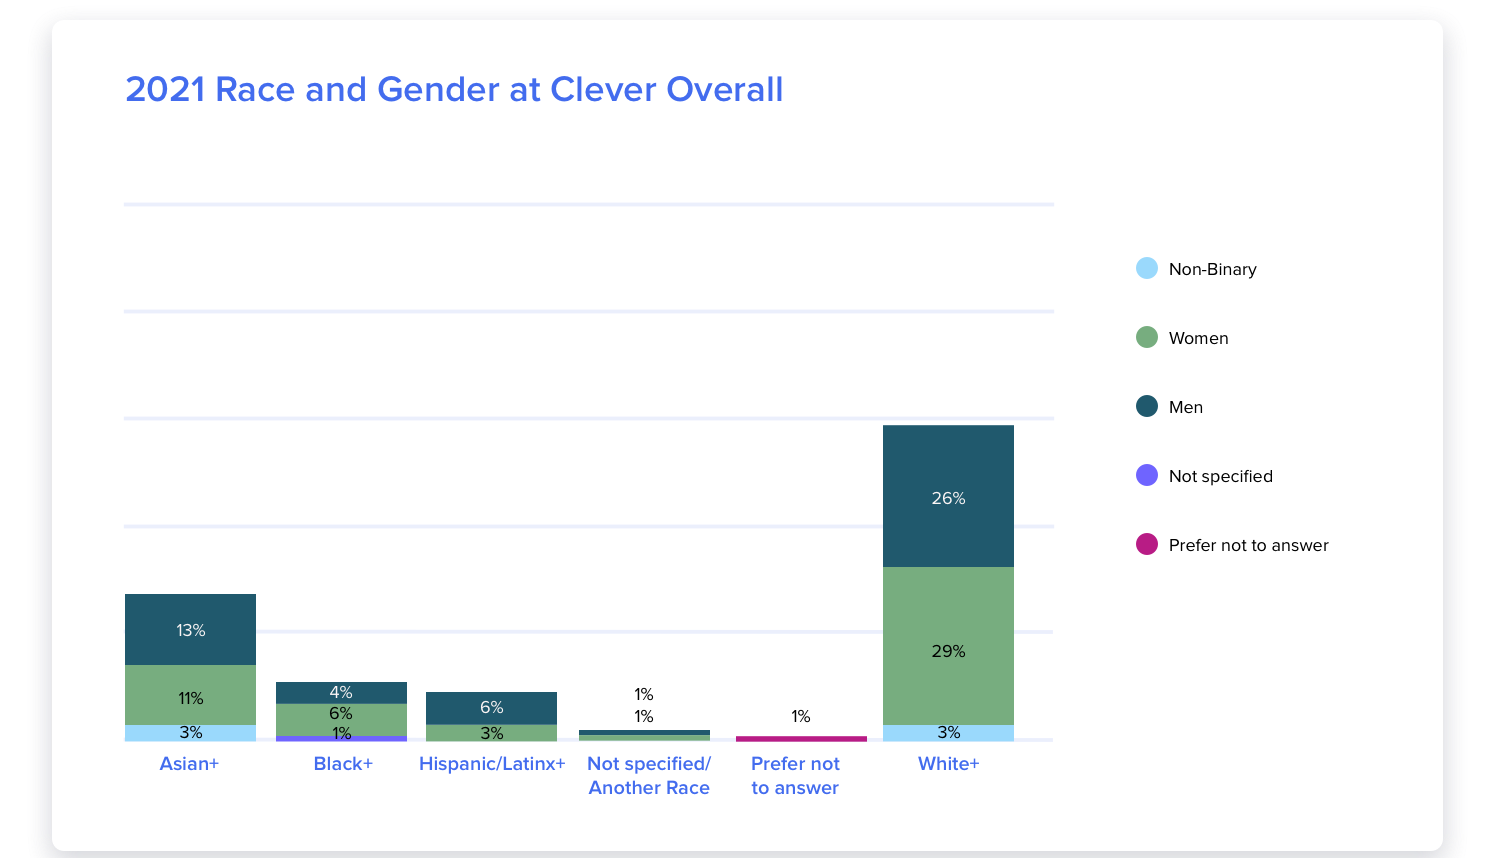
For the first time this year, we are also sharing demographic data at the intersection of race and gender for Clever overall. Intersectionality, a framework first coined by Kimberlé Crenshaw in 1989, helps us to unpack how race, gender, and other social identities might overlap with one another. Applying this lens enables us to understand in even greater depth how we need to refine our efforts to diversify.
Currently, the proportion of white men to white women and the proportion of Asian men to Asian women are relatively balanced. While we must work to increase the representation of Black and Latinx employees overall, we have a specific opportunity to increase the representation of Black men and Latina women. Of course, gender representation off the binary can be improved across all racial groups company-wide as well.
In 2022, we’ll continue to pay close attention to the intersection of race and gender in our demographics.
Next steps
As we write this, we are currently developing plans for 2022. Overall, 2021 was a foundation-setting year to ensure we’re well-positioned to drive even more impact with our efforts in the coming years. While this included implementing new initiatives around recruiting and hiring, we also know how critical it is to have the right foundational structures and systems in place.
Continued commitment
While there’s an opportunity to diversify gender identities at Clever, we’ll place a specific focus on this in our engineering and technical departments.
Examining current practices in recruiting/hiring
We believe one of the most important actions we can take is to look critically at our own hiring and interviewing processes and practices. This year, we started to continuously examine our pass through rates at each stage in our hiring process. When appropriate, we shifted our interview processes to be more inclusive and expansive. In some departments, we revamped rubrics to be clearer and evidence driven.
In 2022, we plan to continue this process of looking inward.
More initiatives in hiring and recruiting
Creating more rigorous processes, structures and systems enabled us to implement a number of new initiatives across the organization.
This year, we significantly increased our efforts around sourcing to diversify our candidate pools early on in the process. This included partnerships with several organizations as well as creating a strategy for recruitment on university campuses, which we have seen some success from this year. We piloted interviewer and hiring manager training to support our Cleverites to more deeply understand their unique roles in our hiring/recruiting process and to interrogate their own biases throughout.
Beyond hiring and recruiting
While we’ll continue to drive action that helps us reach our ultimate aspirations through hiring and recruiting, we know that this work must also extend beyond that. We’re also committed to internally focusing on employee retention and engagement. We must have other efforts that impact how people experience and contribute to our culture and overall organization, and it’s a non-negotiable that we constantly reflect as a company and as individuals to combat ways we might perpetuate exclusive behaviors, practices and systems. Externally, we’re excited about partnering with various organizations to contribute to causes that we care deeply about, such as advocating for digital inclusion in the United States.
We have a long way to go but we’re compelled to move forward in ways that will make us a better organization overall.
To find out more about our efforts around inclusion and belonging from 2021, please see this post — Year in review: Inclusion and Belonging in 2021.
A note on methodology
Not all Clever employees filled out the organization-wide survey that this reporting is based upon and so we have an imperfect data set. For this report, we are only sharing a subset of the data. For all data presented here, our reporting minimum was more than 3 employees who identified with groups that, if reported, could potentially violate privacy.
We count multiracial people as a member of all the racial/ethnic categories they identify with; this is denoted with a plus sign. Because of rounding and how we ensure the identities of multiracial people are fully honored, the individual percentages may not add up exactly to the overall percentage.
To learn more about inclusion and belonging at Clever, visit our website.

More to read
Company
December 17, 2024
Year in review: Inclusion and Belonging in 2024A snapshot of our learnings around inclusion and belonging for 2024 – our focuses, our progress, and where we need to improve.
Company

Company
Districts
August 9, 2024
Welcoming Texas-based Dominic Via as Clever’s VP of SalesLearn about the major challenges Dominic Via is seeing for K-12 leaders, the latest successes in Texas schools, and upcoming trends that will impact school districts this year.