3 ways to use infographics in the classroom
This article is part of a series that spotlights learning apps available in the Clever Library, a place where teachers can discover and adopt great apps for their classrooms through the Clever portal.
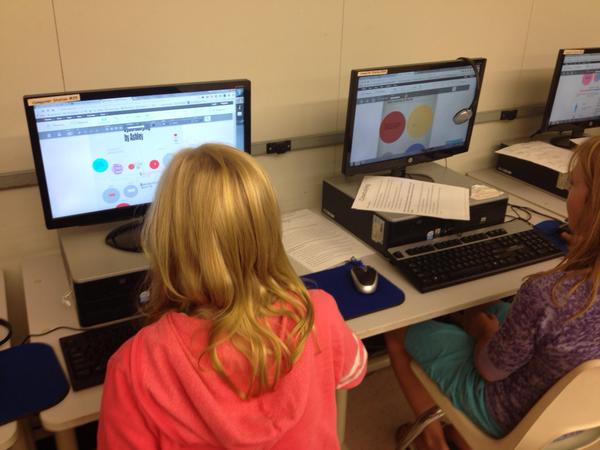
As an educator, you’ve already recognized the importance of visual literacy in promoting deeper learning. Plus, it’s engaging and fun for students and teachers alike. What’s even more impressive is that visual aids in the classroom can improve learning by up to 400 percent.
Easelly is a simple infographic creation maker that enables anyone to represent an idea visually. Its intuitive interface allows ease of use and offers many options for customization.
If you want to further improve visual literacy in the classroom through infographics, keep reading for simple, practical examples!
Use infographics to gauge student learning
Have you thought about asking students to create an infographic highlighting what they’ve just learned in class?
Infographics will teach students to focus on the most important takeaways of a lesson, course, or classroom activity. You’ll be surprised how each student interprets an idea or insight from your class using pictograms, charts, and infographics.
Use infographics as a tool for end-of-the-school-year reflections
Apart from keeping track of your lessons throughout the season or semester, you can use infographics in class for end-of-year reflections. For example, encourage students to share a book, lesson, or activity that they’ve enjoyed the most throughout the year through an infographic!
Use an infographic creation activity to help students sharpen their research skills
Making infographics from scratch in your class isn’t just about creativity. It’s also an excellent way for them to improve their research chops. As part of an infographic creation session in class, encourage your students to ask better questions, find trustworthy information, and seek opposing views or perspectives.
Your turn!
Are you looking for more fun infographic activities in the classroom? These infographic creation resources are tailored specifically for classroom activities:
- Infographic Activity Book for Students (Free download)
- Why Are Infographics Effective in the Classroom? (Blog post with more examples)
- How to Make Infographics With Students (Video tutorial)
And if you’re ready to get those creative muscles going, start an infographic activity in class with Easelly, available in the Clever Library for free!

More to read

April 14, 2025
Clever Substitute Access: Secure learning continues even when teachers are outDigital learning gives teachers and students many exciting ways to engage and learn. But what happens when a teacher is absent and a substitute is in charge?
August 21, 2023
Badges: How teachers saved 200k hours in a school yearThree teachers share their stories and advice for using Clever Badges in their K-3 classrooms.
July 5, 2023
AI proves time-saving potential for teachers, but are they ready?Educators and administrators agree that artificial intelligence will revolutionize K-12 education, however teachers’ are skeptical of the tool despite its time-saving potential. How can districts prepare educators for the integration of AI in classrooms?


