Data-driven decisions start here
Turn millions of logins into actionable insights. Clever Analytics gives you the tools, free of charge, to understand how students and teachers use edtech.


Analytics designed for schools
Edtech data all in one place
Gain complete visibility into edtech engagement with Clever’s built-in dashboards and reports. Make informed decisions on purchasing and planning with the most historical and accurate data around.


Integrated with everything
Track access to any edtech program – even those accessed outside of Clever – to get the whole picture of edtech usage. Use pre-built dashboards, or export the data to your favorite tool.


Free of charge
Access all of our reports, extensions, and dashboards for free. No per user charge, no mandated rostering method, no restrictions on your data – it’s yours to analyze.


What you’ll get


Edtech Analytics
A secure browser extension that shows all application usage in one place – down to the school and grade level, whether or not they are integrated with Clever. Available for Chromebooks and Windows devices.

Portal Analytics
Get a clear understanding of Edtech usage–including daily users, the most popular apps and logins by school. Adjust the time frame, user type, and more. View reports and data right in Clever, or export the reports to analyze them in your tools.

Participation and Resource Usage Reports
Daily snapshots sent straight to you. Understand usage trends for students, teachers, and staff in your district, including those that may be inactive.

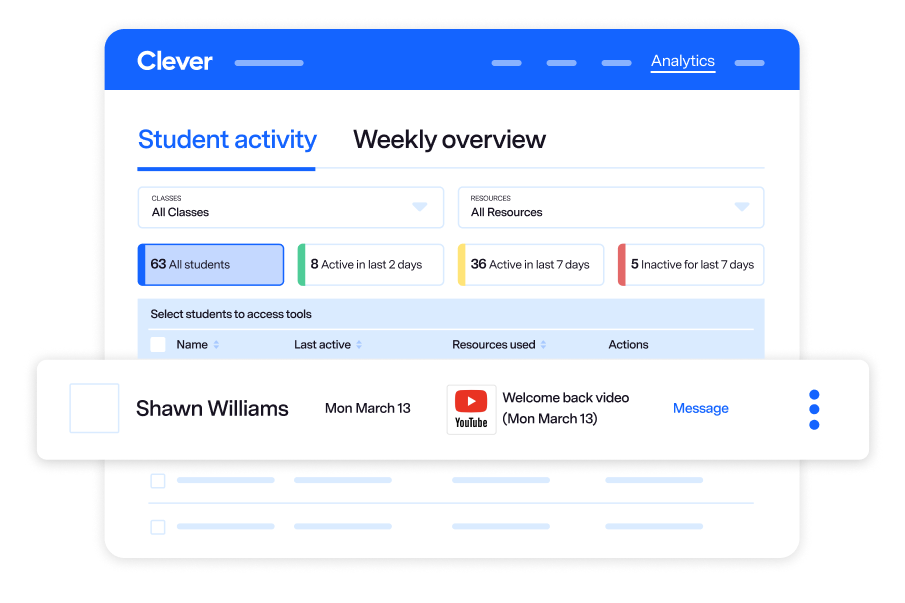
Class Analytics
Edtech usage for each individual student, designed for teachers. Educators can identify students in need of support, and take immediate action to help them keep learning.


CASE STUDY
How Oakland used data to get students online during COVID-19
Learn how Oakland Unified School District closed the digital divide, and how you can leverage good data to provide equitable access in your district.


See what Clever can do for you
Get started


